


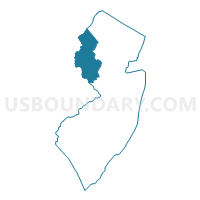
General Assembly District 23, New Jersey
About
Outline

Summary
| Unique Area Identifier | 197809 |
| Name | General Assembly District 23 |
| State | New Jersey |
| Area (square miles) | 767.62 |
| Land Area (square miles) | 752.26 |
| Water Area (square miles) | 15.36 |
| % of Land Area | 98.00 |
| % of Water Area | 2.00 |
| Latitude of the Internal Point | 40.70055100 |
| Longtitude of the Internal Point | -74.95597730 |
| Total Population | 229,972 |
| Total Housing Units | 91,670 |
| Total Households | 86,066 |
| Median Age | 42.5 |
Maps
Graphs
Select a template below for downloading or customizing gragh for General Assembly District 23, New Jersey


Neighbors
Neighoring State Legislative District Lower Chamber (by Name) Neighboring State Legislative District Lower Chamber on the Map
- General Assembly District 15, NJ
- General Assembly District 16, NJ
- General Assembly District 24, NJ
- State House District 136, PA
- State House District 137, PA
- State House District 143, PA
- State House District 189, PA
- State House District 29, PA
Top 10 Neighboring County (by Population) Neighboring County on the Map
- Bucks County, PA (625,249)
- Morris County, NJ (492,276)
- Mercer County, NJ (366,513)
- Somerset County, NJ (323,444)
- Northampton County, PA (297,735)
- Monroe County, PA (169,842)
- Sussex County, NJ (149,265)
- Hunterdon County, NJ (128,349)
- Warren County, NJ (108,692)
Top 10 Neighboring County Subdivision (by Population) Neighboring County Subdivision on the Map
- Hillsborough township, Somerset County, NJ (38,303)
- Mount Olive township, Morris County, NJ (28,117)
- Easton city, Northampton County, PA (26,800)
- Montgomery township, Somerset County, NJ (22,254)
- Raritan township, Hunterdon County, NJ (22,185)
- Washington township, Morris County, NJ (18,533)
- Hopewell township, Mercer County, NJ (17,304)
- Readington township, Hunterdon County, NJ (16,126)
- Middle Smithfield township, Monroe County, PA (15,997)
- Phillipsburg town, Warren County, NJ (14,950)
Top 10 Neighboring Place (by Population) Neighboring Place on the Map
- Easton city, PA (26,800)
- Phillipsburg town, NJ (14,950)
- Hackettstown town, NJ (9,724)
- Washington borough, NJ (6,461)
- Flemington borough, NJ (4,581)
- Beattystown CDP, NJ (4,554)
- Lambertville city, NJ (3,906)
- High Bridge borough, NJ (3,648)
- Panther Valley CDP, NJ (3,327)
- Greenwich CDP, NJ (2,755)
Top 10 Neighboring Elementary School District (by Population) Neighboring Elementary School District on the Map
- Flemington-Raritan Regional School District, NJ (26,766)
- Washington Township School District, NJ (18,533)
- Readington Township School District, NJ (16,126)
- Branchburg Township School District, NJ (14,459)
- Clinton Township School District, NJ (13,478)
- Byram Township School District, NJ (8,350)
- Bedminster Township School District, NJ (8,165)
- Lopatcong Township School District, NJ (8,014)
- Mansfield Township School District, NJ (7,725)
- Blairstown Township School District, NJ (7,663)
Top 10 Neighboring Secondary School District (by Population) Neighboring Secondary School District on the Map
- Hunterdon Central Regional School District, NJ (51,468)
- North Hunterdon-Voorhees Regional School District, NJ (51,047)
- West Morris Regional School District, NJ (38,870)
- Warren Hills Regional School District, NJ (24,013)
- Delaware Valley Regional School District, NJ (16,680)
- Lenape Valley Regional School District, NJ (15,192)
- Kittatinny Regional School District, NJ (14,746)
- North Warren Regional School District, NJ (12,948)
- South Hunterdon Regional School District, NJ (8,284)
Top 10 Neighboring Unified School District (by Population) Neighboring Unified School District on the Map
- Central Bucks School District, PA (114,377)
- Easton Area School District, PA (63,870)
- East Stroudsburg Area School District, PA (47,915)
- Hillsborough Township School District, NJ (38,721)
- Stroudsburg Area School District, PA (34,609)
- Mount Olive Township School District, NJ (28,117)
- Montgomery Township School District, NJ (22,936)
- Bangor Area School District, PA (22,655)
- Hopewell Valley Regional School District, NJ (21,811)
- Wilson Area School District, PA (15,477)
Top 10 Neighboring State Legislative District Upper Chamber (by Population) Neighboring State Legislative District Upper Chamber on the Map
- State Senate District 24, PA (278,648)
- State Senate District 20, PA (273,416)
- State Senate District 18, PA (267,805)
- State Senate District 10, PA (259,178)
- State Senate District 23, NJ (229,972)
- State Senate District 16, NJ (215,874)
- State Senate District 24, NJ (215,703)
- State Senate District 15, NJ (204,558)
Top 10 Neighboring 111th Congressional District (by Population) Neighboring 111th Congressional District on the Map
- Congressional District 15, PA (721,828)
- Congressional District 12, NJ (701,881)
- Congressional District 11, PA (687,860)
- Congressional District 11, NJ (674,349)
- Congressional District 7, NJ (672,885)
- Congressional District 8, PA (672,685)
- Congressional District 5, NJ (666,551)
Top 10 Neighboring Census Tract (by Population) Neighboring Census Tract on the Map
- Census Tract 171.02, Northampton County, PA (8,584)
- Census Tract 322, Warren County, NJ (8,014)
- Census Tract 312, Warren County, NJ (7,949)
- Census Tract 315, Warren County, NJ (7,725)
- Census Tract 102, Hunterdon County, NJ (7,664)
- Census Tract 461.06, Morris County, NJ (7,616)
- Census Tract 113.02, Hunterdon County, NJ (7,263)
- Census Tract 112.01, Hunterdon County, NJ (7,235)
- Census Tract 110.02, Hunterdon County, NJ (7,135)
- Census Tract 38, Mercer County, NJ (6,746)
Top 10 Neighboring 5-Digit ZIP Code Tabulation Area (by Population) Neighboring 5-Digit ZIP Code Tabulation Area on the Map
- 18042, PA (41,570)
- 08844, NJ (38,367)
- 08822, NJ (30,354)
- 07840, NJ (29,849)
- 08865, NJ (29,840)
- 18301, PA (28,561)
- 07860, NJ (26,288)
- 08876, NJ (22,179)
- 18013, PA (17,802)
- 18302, PA (17,362)
Data
Demographic, Population, Households, and Housing Units
** Data sources from census 2010 **
Show Data on Map
Download Full List as CSV
Download Quick Sheet as CSV
| Subject | This Area | New Jersey | National |
|---|---|---|---|
| POPULATION | |||
| Total Population Map | 229,972 | 8,791,894 | 308,745,538 |
| POPULATION, HISPANIC OR LATINO ORIGIN | |||
| Not Hispanic or Latino Map | 215,814 | 7,236,750 | 258,267,944 |
| Hispanic or Latino Map | 14,158 | 1,555,144 | 50,477,594 |
| POPULATION, RACE | |||
| White alone Map | 208,724 | 6,029,248 | 223,553,265 |
| Black or African American alone Map | 7,216 | 1,204,826 | 38,929,319 |
| American Indian and Alaska Native alone Map | 319 | 29,026 | 2,932,248 |
| Asian alone Map | 6,670 | 725,726 | 14,674,252 |
| Native Hawaiian and Other Pacific Islander alone Map | 67 | 3,043 | 540,013 |
| Some Other Race alone Map | 3,484 | 559,722 | 19,107,368 |
| Two or More Races Map | 3,492 | 240,303 | 9,009,073 |
| POPULATION, SEX | |||
| Male Map | 113,452 | 4,279,600 | 151,781,326 |
| Female Map | 116,520 | 4,512,294 | 156,964,212 |
| POPULATION, AGE (18 YEARS) | |||
| 18 years and over Map | 175,967 | 6,726,680 | 234,564,071 |
| Under 18 years | 54,005 | 2,065,214 | 74,181,467 |
| POPULATION, AGE | |||
| Under 5 years | 11,799 | 541,020 | 20,201,362 |
| 5 to 9 years | 14,931 | 564,750 | 20,348,657 |
| 10 to 14 years | 16,694 | 587,335 | 20,677,194 |
| 15 to 17 years | 10,581 | 372,109 | 12,954,254 |
| 18 and 19 years | 5,372 | 225,990 | 9,086,089 |
| 20 years | 2,406 | 108,760 | 4,519,129 |
| 21 years | 2,393 | 106,219 | 4,354,294 |
| 22 to 24 years | 7,041 | 326,259 | 12,712,576 |
| 25 to 29 years | 10,314 | 553,139 | 21,101,849 |
| 30 to 34 years | 10,656 | 556,662 | 19,962,099 |
| 35 to 39 years | 13,888 | 588,379 | 20,179,642 |
| 40 to 44 years | 18,670 | 649,918 | 20,890,964 |
| 45 to 49 years | 22,102 | 704,516 | 22,708,591 |
| 50 to 54 years | 21,431 | 674,680 | 22,298,125 |
| 55 to 59 years | 17,200 | 565,623 | 19,664,805 |
| 60 and 61 years | 5,896 | 201,084 | 7,113,727 |
| 62 to 64 years | 8,042 | 279,458 | 9,704,197 |
| 65 and 66 years | 4,210 | 149,028 | 5,319,902 |
| 67 to 69 years | 5,839 | 201,944 | 7,115,361 |
| 70 to 74 years | 6,590 | 260,462 | 9,278,166 |
| 75 to 79 years | 5,309 | 215,715 | 7,317,795 |
| 80 to 84 years | 4,340 | 179,233 | 5,743,327 |
| 85 years and over | 4,268 | 179,611 | 5,493,433 |
| MEDIAN AGE BY SEX | |||
| Both sexes Map | 42.50 | 39.00 | 37.20 |
| Male Map | 41.40 | 37.40 | 35.80 |
| Female Map | 43.40 | 40.30 | 38.50 |
| HOUSEHOLDS | |||
| Total Households Map | 86,066 | 3,214,360 | 116,716,292 |
| HOUSEHOLDS, HOUSEHOLD TYPE | |||
| Family households: Map | 61,124 | 2,226,606 | 77,538,296 |
| Husband-wife family Map | 50,588 | 1,643,377 | 56,510,377 |
| Other family: Map | 10,536 | 583,229 | 21,027,919 |
| Male householder, no wife present Map | 3,157 | 154,134 | 5,777,570 |
| Female householder, no husband present Map | 7,379 | 429,095 | 15,250,349 |
| Nonfamily households: Map | 24,942 | 987,754 | 39,177,996 |
| Householder living alone Map | 20,378 | 811,221 | 31,204,909 |
| Householder not living alone Map | 4,564 | 176,533 | 7,973,087 |
| HOUSEHOLDS, HISPANIC OR LATINO ORIGIN OF HOUSEHOLDER | |||
| Not Hispanic or Latino householder: Map | 82,469 | 2,777,617 | 103,254,926 |
| Hispanic or Latino householder: Map | 3,597 | 436,743 | 13,461,366 |
| HOUSEHOLDS, RACE OF HOUSEHOLDER | |||
| Householder who is White alone | 80,565 | 2,340,060 | 89,754,352 |
| Householder who is Black or African American alone | 1,859 | 428,304 | 14,129,983 |
| Householder who is American Indian and Alaska Native alone | 103 | 8,686 | 939,707 |
| Householder who is Asian alone | 1,962 | 223,319 | 4,632,164 |
| Householder who is Native Hawaiian and Other Pacific Islander alone | 19 | 925 | 143,932 |
| Householder who is Some Other Race alone | 840 | 152,495 | 4,916,427 |
| Householder who is Two or More Races | 718 | 60,571 | 2,199,727 |
| HOUSEHOLDS, HOUSEHOLD TYPE BY HOUSEHOLD SIZE | |||
| Family households: Map | 61,124 | 2,226,606 | 77,538,296 |
| 2-person household Map | 24,738 | 812,884 | 31,882,616 |
| 3-person household Map | 14,145 | 539,679 | 17,765,829 |
| 4-person household Map | 13,956 | 498,316 | 15,214,075 |
| 5-person household Map | 5,726 | 228,492 | 7,411,997 |
| 6-person household Map | 1,759 | 86,142 | 3,026,278 |
| 7-or-more-person household Map | 800 | 61,093 | 2,237,501 |
| Nonfamily households: Map | 24,942 | 987,754 | 39,177,996 |
| 1-person household Map | 20,378 | 811,221 | 31,204,909 |
| 2-person household Map | 4,014 | 144,798 | 6,360,012 |
| 3-person household Map | 330 | 18,350 | 992,156 |
| 4-person household Map | 135 | 7,791 | 411,171 |
| 5-person household Map | 57 | 3,235 | 126,634 |
| 6-person household Map | 19 | 1,302 | 48,421 |
| 7-or-more-person household Map | 9 | 1,057 | 34,693 |
| HOUSING UNITS | |||
| Total Housing Units Map | 91,670 | 3,553,562 | 131,704,730 |
| HOUSING UNITS, OCCUPANCY STATUS | |||
| Occupied Map | 86,066 | 3,214,360 | 116,716,292 |
| Vacant Map | 5,604 | 339,202 | 14,988,438 |
| HOUSING UNITS, OCCUPIED, TENURE | |||
| Owned with a mortgage or a loan Map | 51,818 | 1,532,012 | 52,979,430 |
| Owned free and clear Map | 16,404 | 570,453 | 23,006,644 |
| Renter occupied Map | 17,844 | 1,111,895 | 40,730,218 |
| HOUSING UNITS, VACANT, VACANCY STATUS | |||
| For rent Map | 1,672 | 92,118 | 4,137,567 |
| Rented, not occupied Map | 89 | 4,578 | 206,825 |
| For sale only Map | 1,035 | 39,260 | 1,896,796 |
| Sold, not occupied Map | 244 | 8,145 | 421,032 |
| For seasonal, recreational, or occasional use Map | 896 | 134,903 | 4,649,298 |
| For migrant workers Map | 8 | 156 | 24,161 |
| Other vacant Map | 1,660 | 60,042 | 3,652,759 |
| HOUSING UNITS, OCCUPIED, AVERAGE HOUSEHOLD SIZE BY TENURE | |||
| Total: Map | 2.60 | 2.68 | 2.58 |
| Owner occupied Map | 2.72 | 2.79 | 2.65 |
| Renter occupied Map | 2.14 | 2.47 | 2.44 |
| HOUSING UNITS, OCCUPIED, TENURE BY RACE OF HOUSEHOLDER | |||
| Owner occupied: Map | 68,222 | 2,102,465 | 75,986,074 |
| Householder who is White alone Map | 64,798 | 1,717,602 | 63,446,275 |
| Householder who is Black or African American alone Map | 1,107 | 171,748 | 6,261,464 |
| Householder who is American Indian and Alaska Native alone Map | 54 | 3,523 | 509,588 |
| Householder who is Asian alone Map | 1,483 | 137,287 | 2,688,861 |
| Householder who is Native Hawaiian and Other Pacific Islander alone Map | 9 | 375 | 61,911 |
| Householder who is Some Other Race alone Map | 323 | 45,382 | 1,975,817 |
| Householder who is Two or More Races Map | 448 | 26,548 | 1,042,158 |
| Renter occupied: Map | 17,844 | 1,111,895 | 40,730,218 |
| Householder who is White alone Map | 15,767 | 622,458 | 26,308,077 |
| Householder who is Black or African American alone Map | 752 | 256,556 | 7,868,519 |
| Householder who is American Indian and Alaska Native alone Map | 49 | 5,163 | 430,119 |
| Householder who is Asian alone Map | 479 | 86,032 | 1,943,303 |
| Householder who is Native Hawaiian and Other Pacific Islander alone Map | 10 | 550 | 82,021 |
| Householder who is Some Other Race alone Map | 517 | 107,113 | 2,940,610 |
| Householder who is Two or More Races Map | 270 | 34,023 | 1,157,569 |
| HOUSING UNITS, OCCUPIED, TENURE BY HISPANIC OR LATINO ORIGIN OF HOUSEHOLDER | |||
| Owner occupied: Map | 68,222 | 2,102,465 | 75,986,074 |
| Not Hispanic or Latino householder Map | 66,254 | 1,943,837 | 69,617,625 |
| Hispanic or Latino householder Map | 1,968 | 158,628 | 6,368,449 |
| Renter occupied: Map | 17,844 | 1,111,895 | 40,730,218 |
| Not Hispanic or Latino householder Map | 16,215 | 833,780 | 33,637,301 |
| Hispanic or Latino householder Map | 1,629 | 278,115 | 7,092,917 |
| HOUSING UNITS, OCCUPIED, TENURE BY HOUSEHOLD SIZE | |||
| Owner occupied: Map | 68,222 | 2,102,465 | 75,986,074 |
| 1-person household Map | 12,578 | 418,027 | 16,453,569 |
| 2-person household Map | 23,988 | 671,621 | 27,618,605 |
| 3-person household Map | 12,087 | 378,218 | 12,517,563 |
| 4-person household Map | 12,452 | 373,606 | 10,998,793 |
| 5-person household Map | 5,037 | 166,068 | 5,057,765 |
| 6-person household Map | 1,471 | 58,752 | 1,965,796 |
| 7-or-more-person household Map | 609 | 36,173 | 1,373,983 |
| Renter occupied: Map | 17,844 | 1,111,895 | 40,730,218 |
| 1-person household Map | 7,800 | 393,194 | 14,751,340 |
| 2-person household Map | 4,764 | 286,061 | 10,624,023 |
| 3-person household Map | 2,388 | 179,811 | 6,240,422 |
| 4-person household Map | 1,639 | 132,501 | 4,626,453 |
| 5-person household Map | 746 | 65,659 | 2,480,866 |
| 6-person household Map | 307 | 28,692 | 1,108,903 |
| 7-or-more-person household Map | 200 | 25,977 | 898,211 |
Loading...